SINFI Data Management
/in Applications /by admin9892SINFI Data Reclassification Service
The Federated National Information System of Infrastructures (SINFI) is the identified tool for coordination and transparency for the new broadband and ultra-broadband italian strategy. SINFI promotes the sharing of geographical and alphanumeric data relating to infrastructures, through an clear management of the underground and above ground and related interventions, and offers a single dashboard to efficiently manage and monitor all interventions.
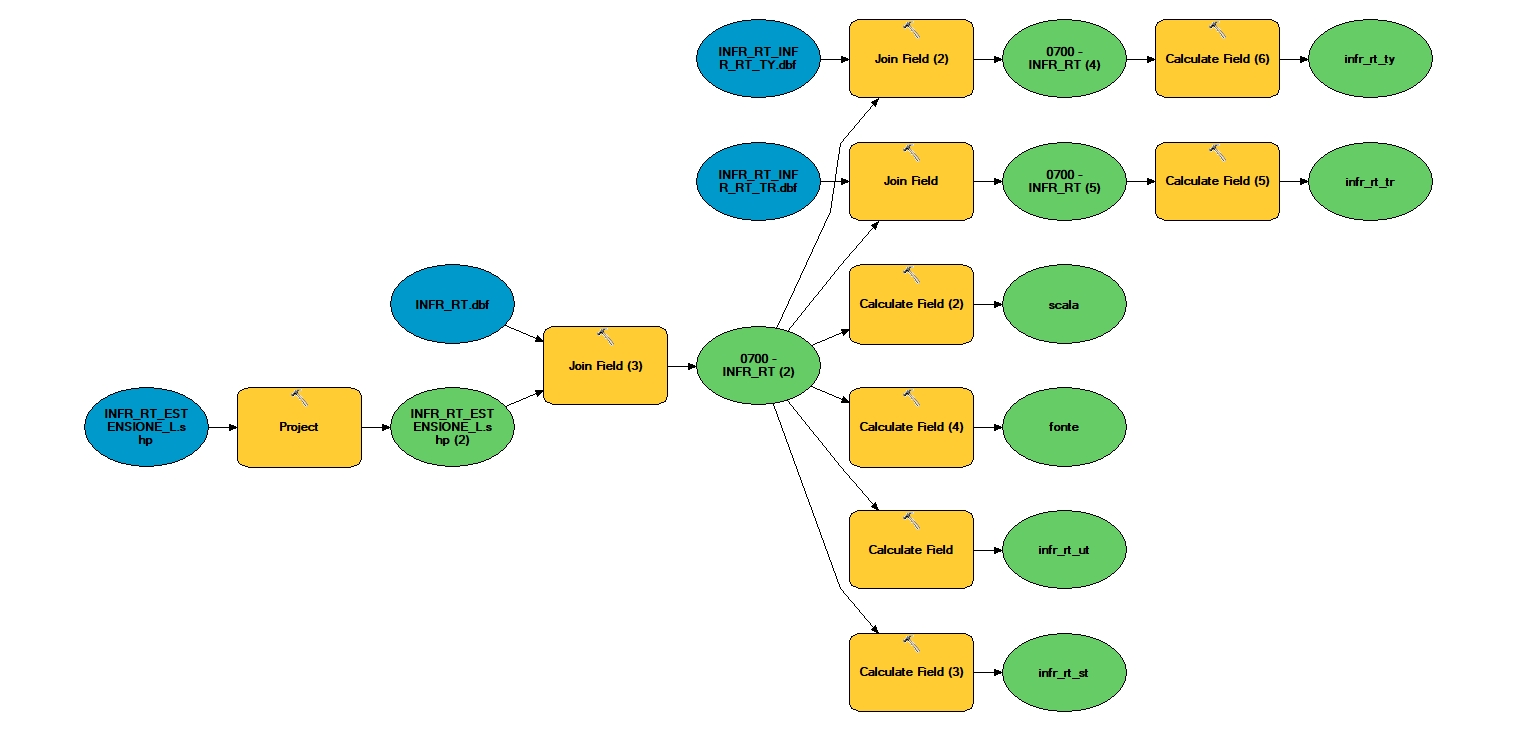
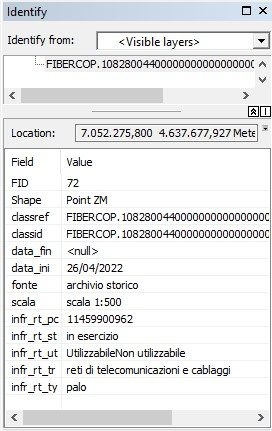
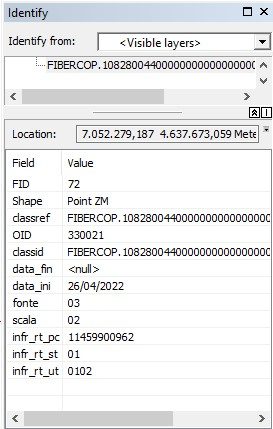
Iptsat has developed and consolidated a series of procedures aimed at making SINFI data easy to read and interpret for the end user. The proposed service aims to convert SINFI alphanumeric attributes into understandable text attributes, thanks to the use of GIS technology.
The working process starts from the study, analysis and translation of native SINFI data to create workflows and tools aimed at automating the conversion of tables and attributes into comprehensible and concise texts. These tools can be provided directly to the end user. Alternatively, Iptsat is able to autonomously follow the entire work process and deliver the results obtained to the customer.
Software Development
/in Applications /by admin9892Software Development
iptsat develops enterprise-grade web and mobile software for displaying alphanumeric and geographical data, business intelligence, reporting, geo-location, IOT. We use the most innovative development technologies such as JS, Laravel, JQuery, Node.js frameworks, MVC architectures in PHP and Java, relational and NoSQL databases of millions of records. We coordinate with the most effective Lean and Agile methodologies such as Scrum.
Public lighting monitoring
/in Applications /by admin9892Public lighting monitoring
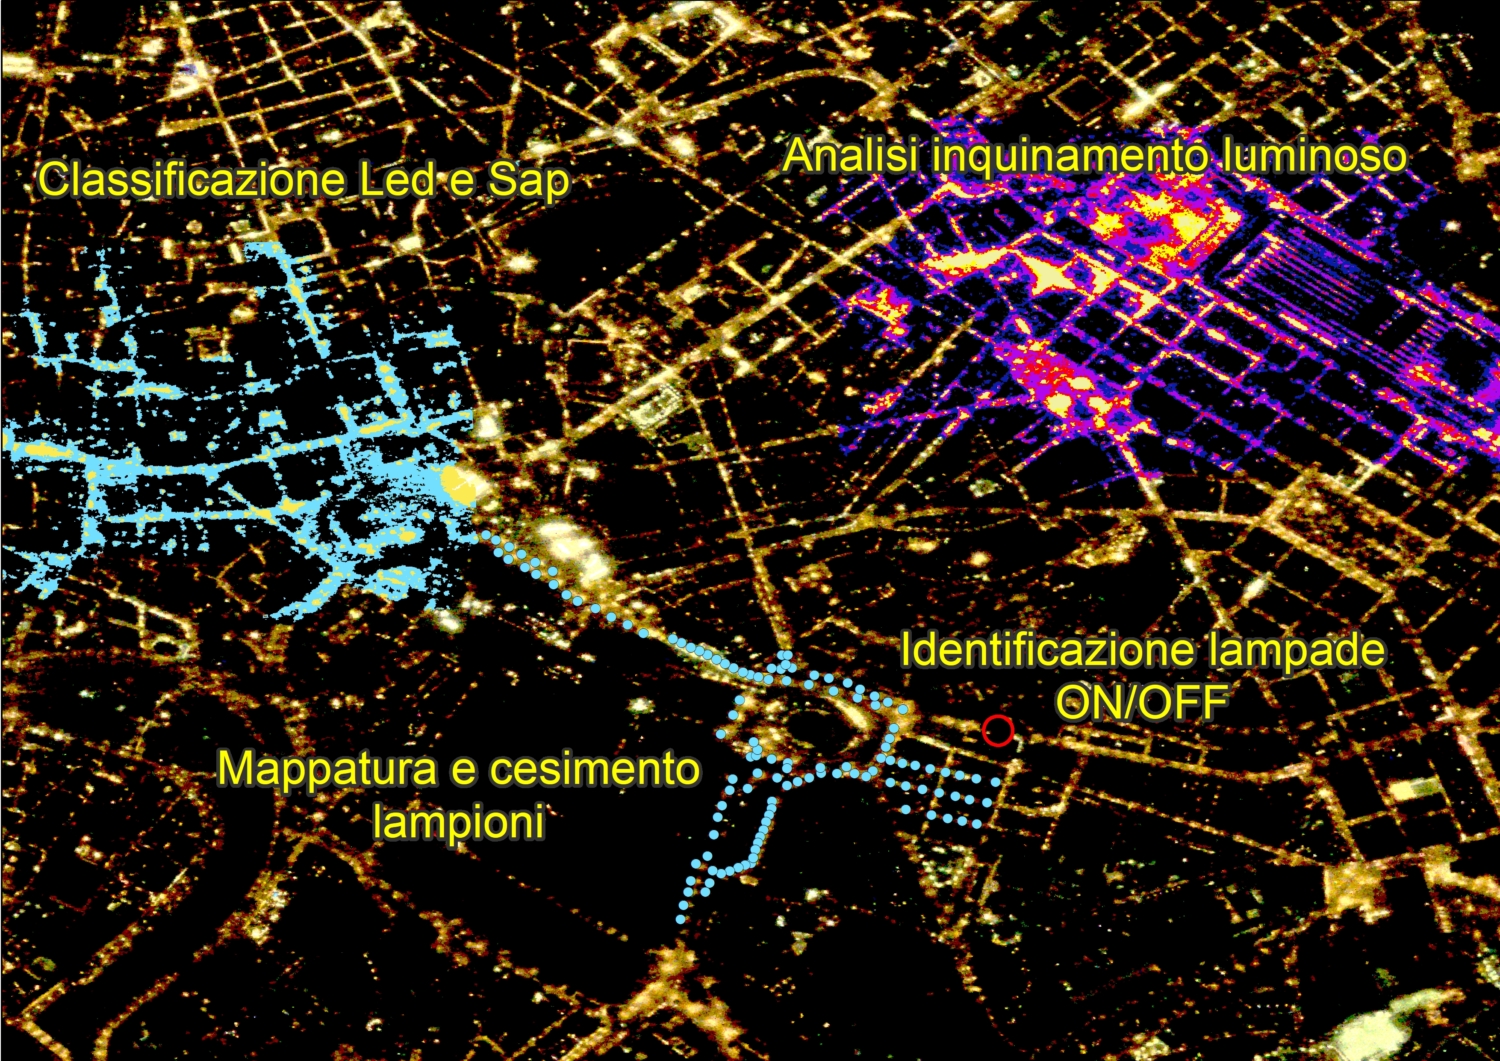
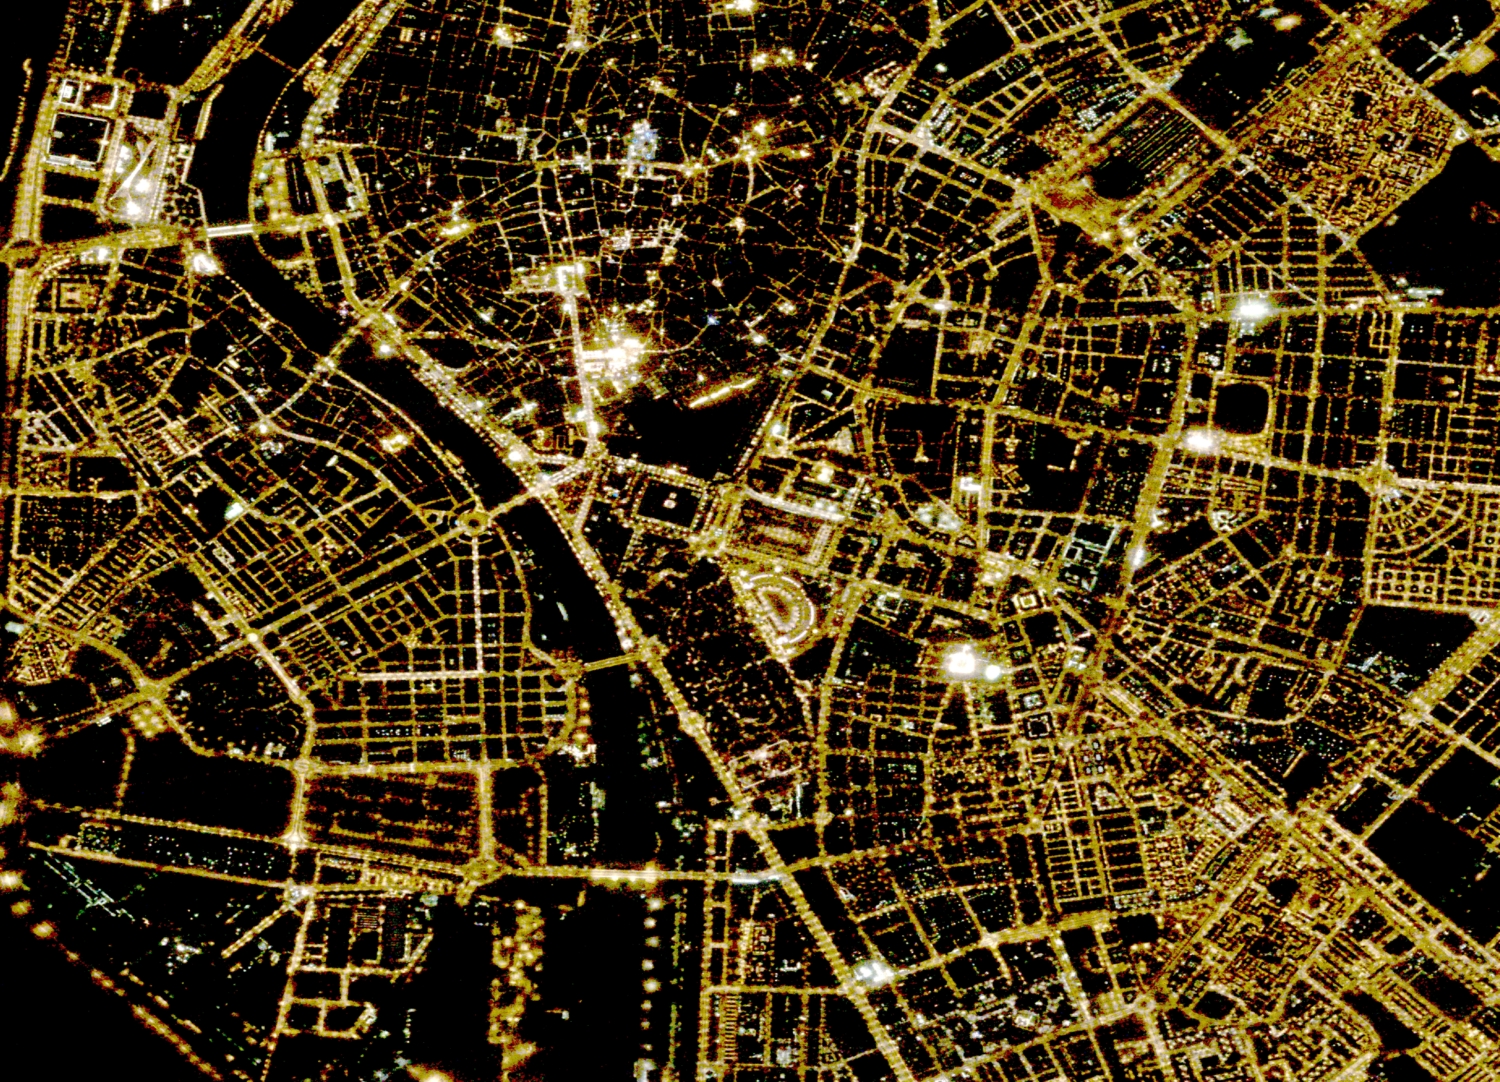
Mapping and census of lighting systems through night-time satellite images
Iptsat, thanks to its knowledge in the Gis and Remote Sensing sector and the great experience in the geolocation of infrastructures in the utility sector, has developed innovative solutions for the mapping, census and control of lighting systems in urban areas and extra urban. Specifically, these services are based on solid GIS procedures that exploit the information derived from night-time satellite images at 90 cm resolution. This makes it possible to analyze large areas of the territory even several times a year.
By now, iptsat has acquired considerable experience on these technologies and procedures. In fact, he has mapped more than 500,000 light points in recent years.
Access to these services allows companies that deal with the public lighting network to geolocate and monitor their systems at sustainable costs and to avoid, in many cases, census and on-site control actions.
The objectives that can be achieved through these advanced technologies are:
Mapping and census of public lighting systems.
The geolocation of the infrastructures can be achieved either starting from a dataset already in the customer’s possession or even without any previous data available. In the first case, the confirmed light points are indicated, those confirmed but relocated with greater accuracy, those no longer present in the area and the light points present in reality but non-existent on the customer’s dataset. In the second case a new dataset is created.
In both situations, thanks to the continuous dialogue with the customer through dedicated webapps, maximum attention is given to identifying only the public network, reclaiming the results from any lights of private origin. Finally, even possible visual obstructions, due to vegetation or anthropic physical elements, are managed within the dataset through dedicated legends and attributes, according to the customer’s instructions.
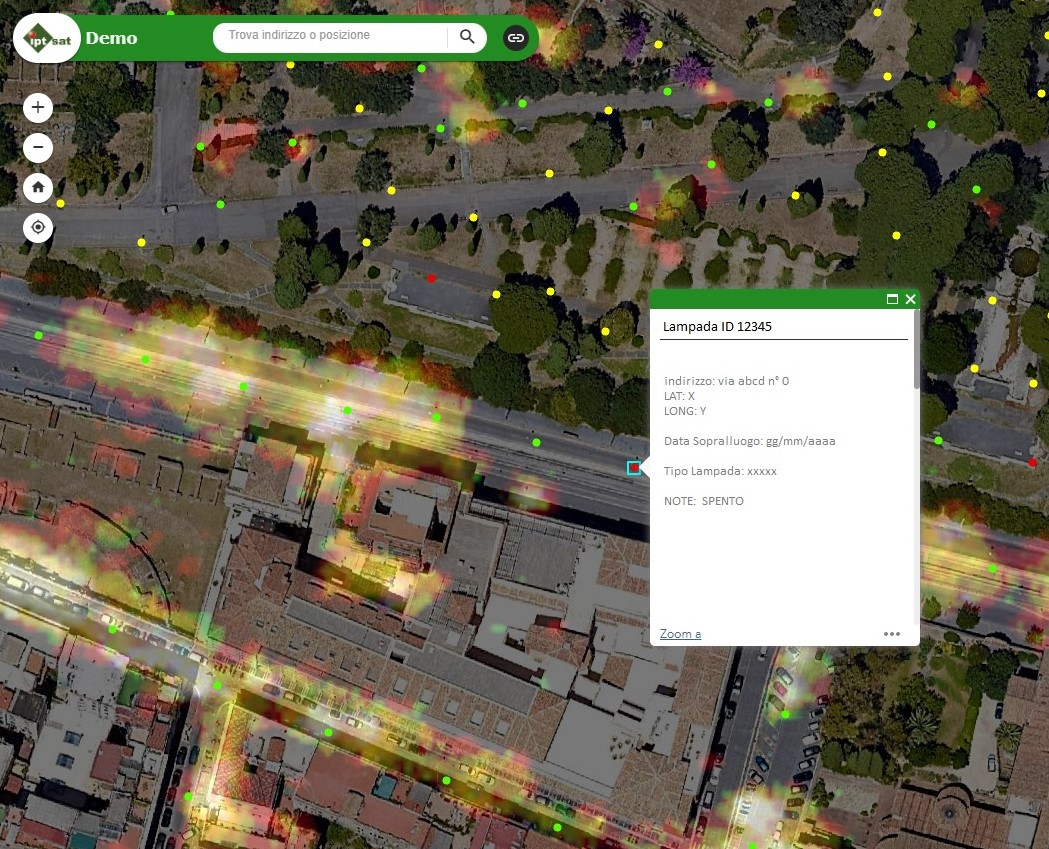
- Identification of switched off light points.
Night satellite images, in addition to being one of the main sources for allowing the correct census of the public lighting network, are a fundamental data for identifying which light points are actually on and which ones are off. This allows you to remotely monitor, at various times during the year, the actual status of the public lighting service. Consequently, it is possible to have both feedback on the reports received from citizens or professionals, and highlight malfunctions and critical issues of which we had no news. - dark area Identification
This service allows you to analyze the territory to identify areas that are not efficiently lit and help network managers in the planning and development of new infrastructures to also improve the safety of citizens. - light pollution Analysis
This service makes it possible to identify excessively lit urban or extra-urban areas (in this case also considering lights of a private and above all industrial nature) and, consequently, to help network managers, public administrators and even scholars in the analysis of light pollution. - Lamp type classification (Led/Sap)
Each type of lamp has its own spectral signature. Using these signatures it is therefore possible to automatically distinguish and classify from the satellite the different types of lamps, such as LED lamps and SAP (High Pressure Sodium) lamps.
Smart Cities
/in Applications /by admin9892URBAN PLANNING AND SMART CITIES
Iptsat boasts a consolidated experience in the territorial planning field, both in the geographic database creation, the thematic cartography drafting, the data preparation, presentation, analysis and interpretation.
Among the services offered:
MUNICIPAL SITE REALIZATION
Iptsat offers to municipalities their own geographical database creation according to the specifications foreseen by the INSPIRE directive, at low cost.
The Municipal Site realization foresees: the Geographic Data Bank creation, the WebGis data publication, the maintenance of the same also through hosting services with diversified users.
DATA STANDARDIZATION RELATING TO LAND REGISTRY
The cadastral data is the cartographic element reference used by administrative authorities for territory planning.
In a cadastral map there are distinctive elements such as cadastral parcels and buildings. Very often, cadastral data are available to administrative bodies in CAD formats not always compatible with the normal GIS system functions.
Iptsat offers support activities to make the cadastral data usable on all GIS platforms.
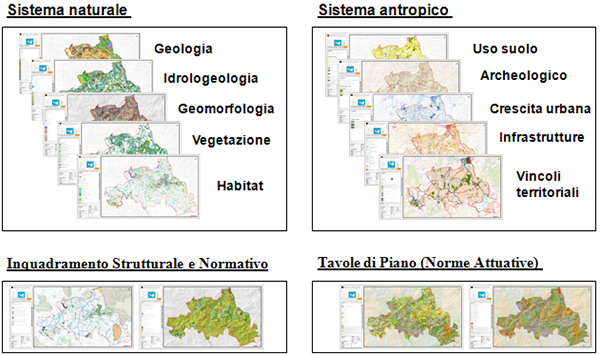
Example of a Regional Territorial Landscape Plan (Sicily Region – Area VI).
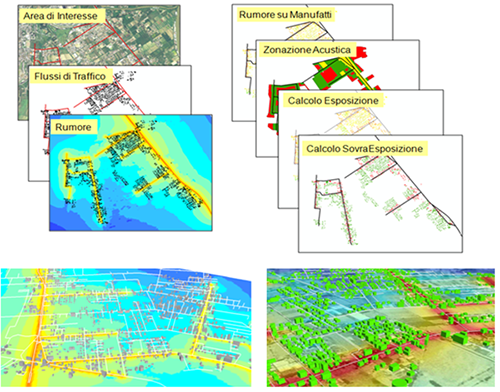
Example of acoustic zoning.
CDU(UPC)
The Urban Planning Certificate is the document containing the technical requirements of land or buildings urban and planning nature and is normally required for sale and succession deeds, contractual stipulations, or in all those cases in which someone needs to know the constraints falling within a given area.
The certification is issued by the municipal offices by the citizen request and is valid for a year.
Iptsat is able to offer automated solutions, both on the local and shared (web) platforms, allowing the UPC release.
The Iptsat solutions provide data organized usage in a (Municipal Territorial Information System).
The UPC is obtained through the a WebGIS application use capable of processing the Site query functions and preparing all the information released by the system, in the following formats:
- alphanumeric
- geographic
- printable
SMART CITIES
The expression smart city indicates, in a broad sense, an urban environment capable to actively improve its citizens quality of life. The intelligent city
manages to reconcile and satisfy its citizens needs, business and institutions, thanks also to the ICT widespread and innovative use, especially in communication, mobility, environment and energy efficiency fields.
Although the meaning of this expression has not yet been uniquely defined in detail, it agrees with the attention to people’s needs characteristics, the careful resources consideration and management, the sustainable development and the economic sustainability. “
Source Wikipedia
Cities became the focal point of the new Millennium politics and economic strategies. The economic development guidelines of international bodies and legislators follow the “megatrends” characterizing the city of the 21st century. These “trends” are:
- The incessant population growth with a continuous increase of the urbanization level
- A significant environmental impact of cities consuming 75% of world’s energy and responsible for 80% of CO2 emissions, with a significant economic and social impact on the consumption together with the immeasurable waste of vital resources
- A vast globalization exposing urban realities to opposite dynamics or continual growth (with problems of overcrowding, congestion, transport inadequacy) or decline (traffic reversal, infrastructure degradation, less economic resources and development).
What are Smart Cities?
Smart cities are intelligent cities, in practice the cities (as administrations, citizens and companies) capable of connecting technical and technological infrastructures in a smart way.
Perhaps, geospatial data and technologies represent the “smartest” data, capable of solving
different proportions problems.
Iptsat develops infrastructure and geographic data harmonization projects within municipalities, allowing its access and usage by the users greatest number through the conversion in open data and catalogues and webgis publication.
We develop 3D models of cities through Esri CityEngine software
Land
/in Applications /by admin9892Land
The territorial characteristics knowledge and its evolution over the time is the starting point of its management optimization. For this purpose, the study process and the territorial planning are easily supported by GIS solutions (such as geographical database and territorial information systems), as well as by satellite data (historical and updated), especially for:
- Paper and digital cartographic information creation, updating and archiving as well as maps and / or any other geographic and alphanumeric data.
- Territorial data consultation, query and modification also via web
- Building abuses census and control (Multitemporal analysis of urban areas)
- Extracts and certifications direct production
URBAN AREAS
Large cities, as well as medium and small cities are affected by the territorial relevancy resources use and, above all, abuse. Therefore, the need to have modern and effective tools available to control urban expansion, territory degradation and analyze situations potentially at risk for environment and mankind is growing more and more.
URBAN EXPANSION
Urban areas multitemporal analysis, obtained by superimposing images of the same detected territory at different times, offers the possibility to highlight all the changes occurring during the years and allows to follow the urban development of a given area over the time.
The current law regulations stipulate that by 31 December 2003 all the Municipal Administrations are autonomous in their own pertinence Urban and Agricultural Cadastre management .
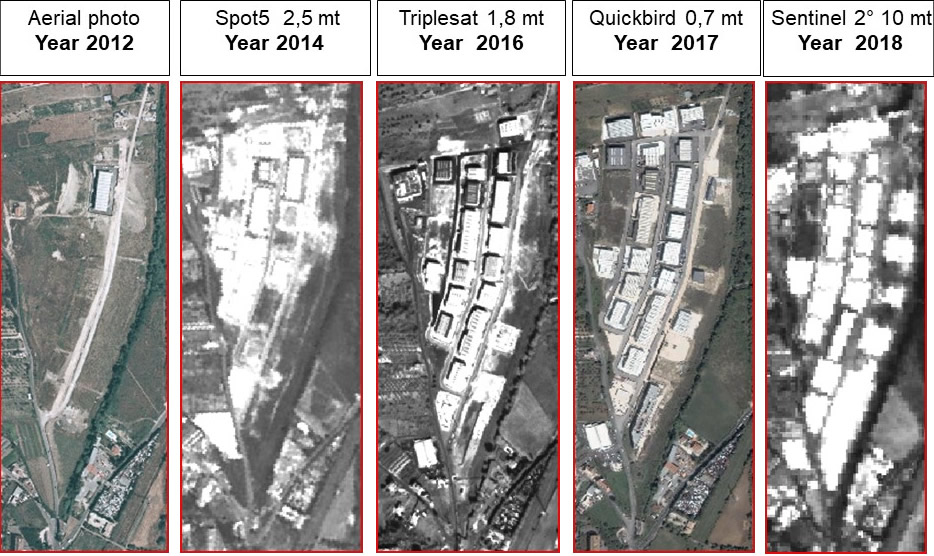
BUILDING ABUSE CENSUS AND CONTROL
The problem of building abuses has always represented municipalities “Achilles’ heel”, because of the reliable documentation lack over the time, or the committed resources to manage the problem are scarce and scattered in the maze of public offices.
Today, such abuses control and repression can also become a derivative source of income thanks to remissions acquisition, amnesties and taxes derived directly and indirectly from these abuses.
The tools used so far to manage this problem proved to be of little use, in fact the
simple cartography, fundamental for many institutional and productive activities, is affected by a constitutional defect deriving from the methodologies used up to now for its production.
As a matter of fact, it is known how the official cartography is precise but suffers from the misalignment with the real situation, due to the scarcity of resources committed to its timely update.
Overflight images are expensive and are old by their very nature; the planes in fact fly
only periodically, at very high costs and with many constraints dictated by aeronautical authorities.
Satellite images, instead, offer a valid solution to these problems since the overflight is continuous and updating is therefore guaranteed, with much lower costs than any other solution. The territory images, remotely sensed by satellite, are used in this sense as a solution capable of promptly providing updated cartographic products coherent in its context, that is, capable of bridging the time gap between the urgent information need and the official reference information possibility.

SEMI-AUTOMATIC ON-LINE CHANGE DETECTION SYSTEM
Change Detection is the technique of processing satellite remotely sensed images, of high resolution in this specific case, for the identification and / or discrimination of environmental variations over the time.
Iptsat is developing a semi-automatic system to analyze all theArcGIS for Server environment changes, through the study of classification algorithms to be implemented within the web-gis.
This research will favor local authorities, willing to join the project, developping activities more effective control and supervision of the area of competence, at very low costs.
Our research target is to protect our cities and environment, providing them with a technical, rapid, economical and sustainable tool, selected among many innovations, in order to represent the Italian innovating companies at the World Expo in Shanghai 2010.
Geomarketing and Statistics
/in Applications /by admin9892GEOMARKETING AND STATISTICS
GEOMARKETING means the use of geography to make the decisions and activities concerning Communication, Sale, Distribution and clients Service more efficient and incisive.
Thanks to Geomarketing, companies enhance the spatial dimension of numerous data, continuously produced by various internal and external information sources.
We can summarize the spatial dimension of a data with the simple word WHERE. Where is a relevant information in the marketing process because geography becomes a unit or even the privileged unit of sales data analysis. From this perspective, the information sequence becomes: WHO – DOES WHAT – WHERE. The first two data (who, does what) thus joined the territory in which they are produced and transformed into relevant information to make a decision.
“Where” can take on many different meanings, according to the decision makers:
Where do our customers reside?
Where do they work?
Where do they go shopping?
Where do they go in their free time?
Where are our competitors located?
How are our sellers visits configured?
What are the best places to open new stores?
Where are bank branches, public offices, places of attraction and entertainment located? and so on.
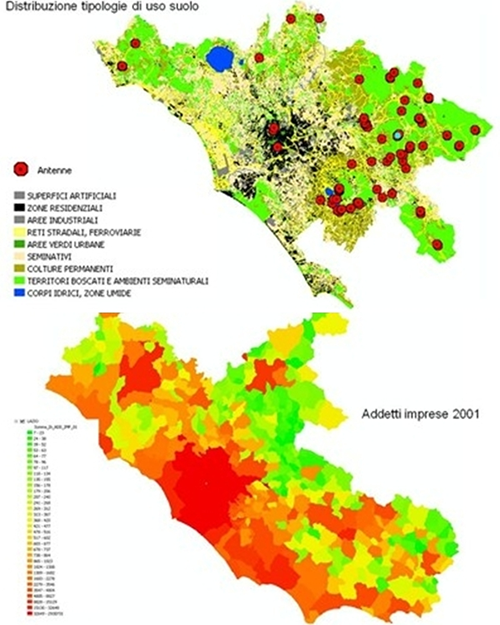
Map example
STATISTICS
Geostatistics is the branch of statistics dealing with geographical data analysis. Its classical application field is Earth Sciences, especially in Geography,
Geology, Environmental Geology, Ecology, Meteorology, Agronomy. It also finds application in other fields such as economic analysis, epidemiological studies, etc.
Geostatistics deals with the spatial data correlation evaluation, verifying whether nearby points observations actually show a higher correlation than distant points observations. So the goal is to evaluate how this autocorrelation varies according to the separation vector considered (therefore distance and time). The study of space continuity and the necessary data exploratory study allow us to observe with outstanding detail the analyzed phenomena, understanding the statistical-spatial data structure in terms of the physical-chemical processes involved.
Also, mapping numbers and tables is easier when associated with maps and geographic details, that is to say, capable of making intelligible data in and of itself already complex.
Energy
/in Applications /by admin9892ENERGY
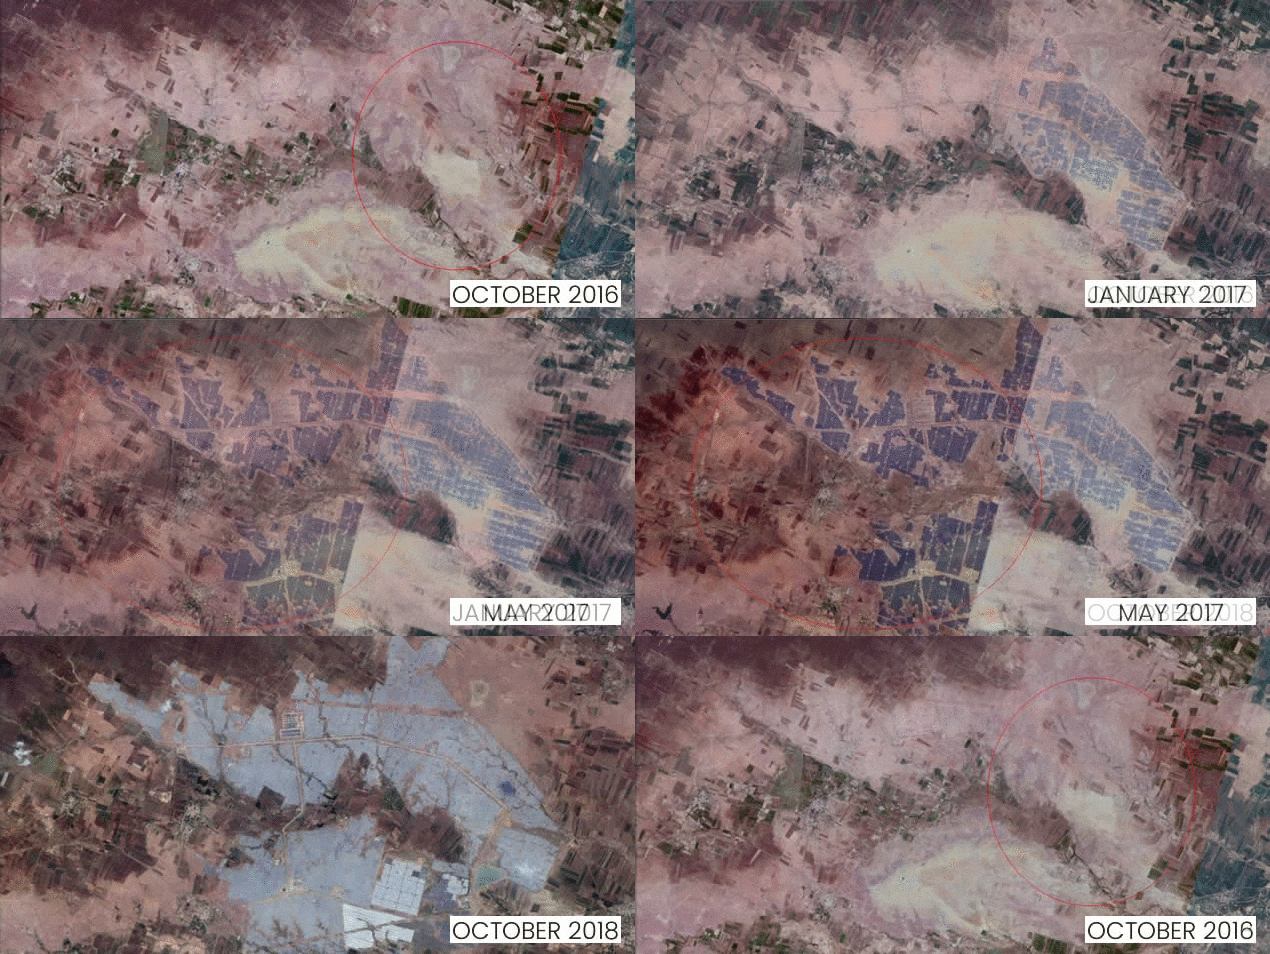
vegetational change detection
Provide innovative and affordable cost-effective technology to monitor and manage from space resources, the electrical grid and renewable infrastructures resources.
Resource planning, management and monitoring An efficient and reliable energy infrastructure is vital for our society. Asset managers and Network operators are under increasing pressure to improve electrical networks and systems performance and reliability. Remote sensing via Earth observation satellites (SatEO) provides an innovative and cost-effective way to support resource planning, resource management and risk management. The need for human inspections is reduced allowing an advanced decision making support and risk management.
Geospatial analysis based on SatEO for the assets and risks strategic management
Geospatial analysis based on satellite remote sensing data offers an additional source of data able to complete or replace traditional methods often based on expensive and strenous human inspections. For example, it can detect natural hazard risks of natural such as fires, floods and ground structural failure. It helps managing the risks of network and plant resources. Transmission and distribution networks and pipelines, power plants (solar, wind) and substations are some examples of such assets. Satellite images are of great support to:
- reduce the need of human inspections
- allow assets economic monitoring locally
- enable advanced, near-real-time decision making support and management
Energy applications of this technology can be classified into resource and network planning, resource management and operational risk management.
Asset and network planning:
- Site selection eg. wind farms, power lines, pipeline infrastructures
- Geotechnical, geophysical and altimetric survey of the site

Resource management:
- Assessment of vegetation invasions
- Asset conditions management: damage, decay, corrosion, etc.
Operational risk management
- Resources monitoring and natural hazards events detection, such as floods, fires, earthquakes and land cave in
- Risk management dashboard providing detailed studies and decision making support based on geospatial analysis
IPTSAT’s remote sensing data products
Future energy companies are using emerging digital technology to reduce operational costs in the resources management and operation. Satellite remote sensing is one of these technologies and can provide information and value to asset managers and operators.
Our satellite-based remote sensing data products provide multi-satellite, multi-sensor, multi-wavelength and multi-polarization processed data images. By aggregating big data and by applying automatic learning workflows, these data flows can be displayed in resource risk management dashboard allowing an improved situation awareness and decision making support.
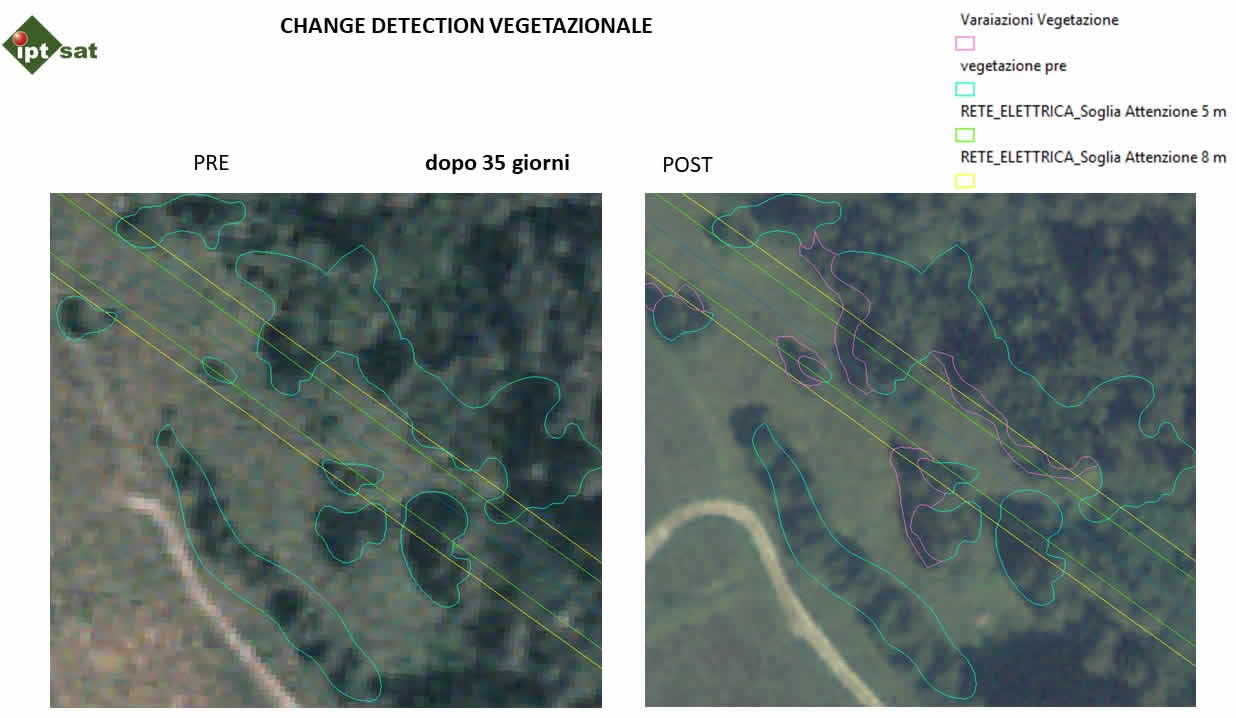
vegetation interference analysis
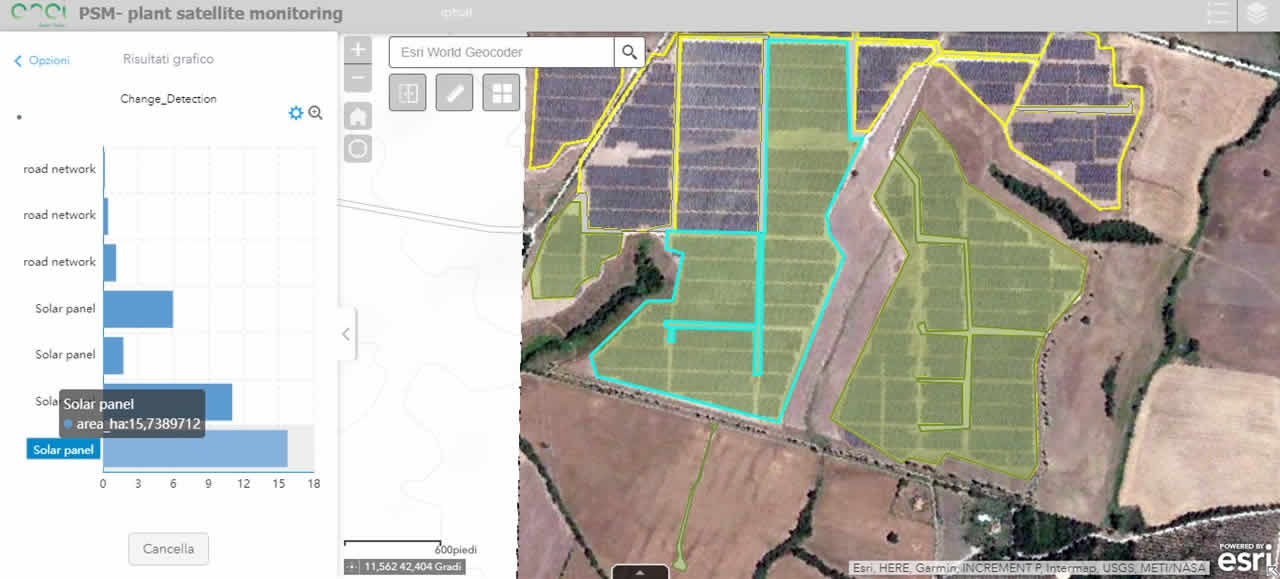
webgis and plant monitoring dashboard
Emergencies and Healthcare
/in Applications /by admin9892EMERGENCIES AND HEALTHCARE
EMERGENCIES
Both historical and up-to-date GIS and geospatial data provide powerful tools to support public administrations and companies interested in prevention and consequently management of all the emergency phases (prevention, mitigation, response and recovery) resulting from natural and environmental disasters. Here some activities to support:
- Supply of satellite images in “near real time”
- Potential disasters mapping and modeling in order to visualize vulnerable areas, critical situations and potential harm
- Data visualization and location to carry out real time analysis
- Emergency situations awareness and visualization
- Recovery activities, humanitarian actions and reconstruction
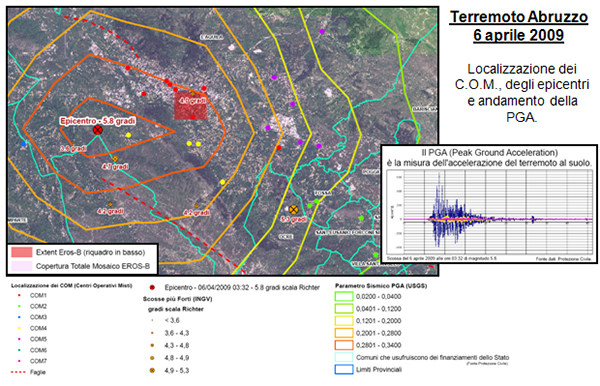
Abruzzo earthquake 6 April 2009 – C.O.M.and epicenters localization and PGA trend.
RISK ANALYSIS
Environmental and territorial risk analysis is critical in the emergency management. The overall sight of the environmental condition and the available data are of primary importance to manage an emergency. The GIS system is a valid tool in the disasters prevention phase for the interventions planning, the available resources organisation, the simulation, the study of previous situations, etc.
Newkirk (1993) explained how a GIS offers potential disasters critical points of view and their impact both before an event and post-event analysis. His concern is that the GIS encourages the user to believe in its accurate data. The system should allow a broader risks examination and its potential or actual impact by estimating validated data a priori, applying extra pre-configured environmental variables.
The advantage of a GIS system is to provide information to improve decision-making processes connected with emergency planning in its different phases, containment, analysis, future planning. A GIS is capable of providing maps at regular intervals and, used together with satellite data, it allows to redesign, in real time, the places new condition. During an emergency management, the GIS provides a significant support to decision making, for example in the calamity evolution analysis and in the calculation of the resources used, in the internal resources management (personnel, equipment, etc.)and finally in the damages assessment and estimation.
The creation of a modern and efficient GIS system is carried out through computerized forecasting, prevention and management emergency functions typical of those Institutions which, due to their institutional task, during a disaster event must safeguard and protect both population and works. The creation of a valid communications system capable of providing and updating databases both in ordinary circumstances (cartographic, technical-
administrative and alphanumeric) than in an emergency phase is the target to pursue for a quick and effective organization. This management ensures the synergy between information technologies and telematics to provide a homogeneous system of decision making support, during the pre and post-emergency.
IPTSAT RISK HAZARD DATABASE
Based on the experience gained over the past 15 years, as well as the participation to various Italian and European projects on the geographical databases structuring, in 2015 Iptsat developed the logical model, the database algorithm relating to the potential risks analysis deriving from both human and natural impact . The database is made up of a series of data derived from institutional sources and proven efficiency commercial database, developped with the scientific collaboration of some important national institutions.
Send an email to request an extract of the demo database
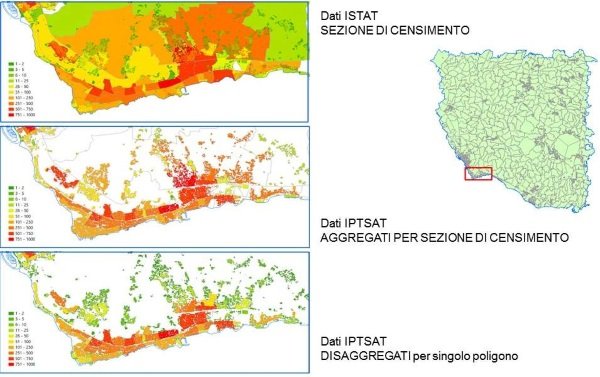
HEALTH
Only nowadays the health sector benefits from GIS enormous potential. Both the public and private sectors are developing innovative ways to take dvantage of data integration and spatial visualization power of the GIS. The kind of companies and organizations adopting GIS totally enclose the health care industry: from public healthcare departments, research organizations and health politics to hospitals, medical centers and health insurance organizations.
Furthermore, gis represents a fundamental tool to manage health statistics by mapping and depicting specific areas, as widely proved during the last pandemic period.
Archeology and Cultural Heritage
/in Applications /by admin9892ARCHEOLOGY AND CULTURAL HERITAGE
GIS systems, drone remote sensing and / or satellites are fundamental tools both for citizens interested in obtaining information on the cultural heritage and for all students and professionals (archaeologists, superintendents, museum administrations …) dealing with the cultural and archaeological heritage management and monitoring Here are some activities supported by GIS and remote sensing solutions:
Process optimization related to the cataloguing and distribution of information involving cultural heritage Analysis to survey and monitor the cultural heritage over the time.
Turn the Information into standard information in order to be shared and used correctly Search and localization of archaeological sites
ARCHEOLOGY
A strong impulse to archaeological research has been provided by satellite remote sensing technology which, through the fine use of sensors with particular spectral bands, allows to highlight lines, broken lines and curves of all the structures otherwise difficult to identify because of the flat perspective, typical of the observation from the ground level. It is thus possible to think of such technologies for the localization of archaeological sites and, moreover, blending these technologies with GIS tools, it is possible to create appropriate Information Systems for archeology.
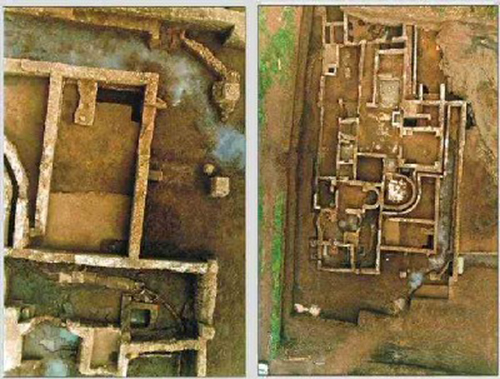
Example of archaelogical sites localizations
ARCHAEOLOGICAL SITES LOCALIZATION
To identify the unknown sites not yet exposed to daylight, this technology can use the information related to the vegetation collocation and the soil moisture, detected by the sensors, luminescence and thermal parameters of the soil itself.
INFORMATION SYSTEMS FOR ARCHEOLOGY
Concerning an archaeological site, the distribution of materials used, its composition and physical characteristics, besides the types of existing deterioration typology, are important elements to include inside an Information System in order to simplify the cataloguing of the materials found and the processing of data, for quantitative and statistical analysis.
In addition to that, a three-dimensional model of the territory extrapolated from the stereoscopical images of the site is a valuable aid in the design of tour itineraries within the site itself.
CULTURAL HERITAGE
Geographical data are essential in the management of architectural and landscape assets and of historical and artistic heritage. The problems related to the enhancement and protection of the Cultural Heritage therefore could find in the GIS technology, as well as in the satellite and drone remote sensing, a valid tool to start a complete conservation process and subsequent intervention and its maintenance, but above all to involve the highest number of users potentially interested in its fruition
Environment and Biodiversity
/in Applications /by admin9892ENVIRONMENT AND BIODIVERSITY
AGRICULTURE
Planet is recognized as one of the few satellite constellations capable of responding quickly and accurately to the requests of people working in the agricultural scope; in fact, the Planet data allow customers to take advantage of their crops images by monitoring to the best their agricultural resources, in every season, all over the year Some possible applications in agriculture:
- Mapping of fields and classification of crops. Evaluation and check of the phenological steps for the agrometeorological models tuning
- Plant health analysis and monitoring of parasitic infestations
- Estimation of damage caused by natural disasters (hail, snow, floods&) or by any other event (fires, earthquakes, landslides …)
- Creation of NDVI, NDVI Red Edge, fPAR, LAI, Chlorophyll, OSAVI, TCARI, MCARI maps…
- Irrigation water management
- Agricultural productivity management
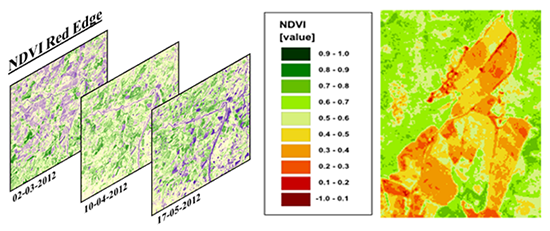
NDVI index example.
VEGETATION
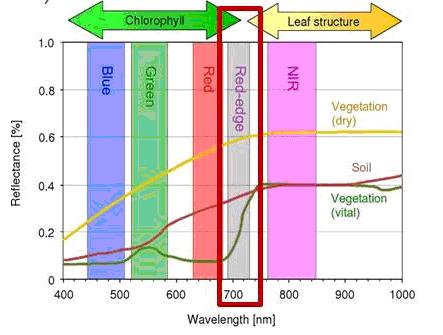
Remote Sensing – Planet Bands Vegetation shows specific spectral behaviors with different wavelengths, producing a characteristic sign.
The reflectance curve can vary its trend depending on many factors such as the vegetation type and its density, the phenological stage, the phyto-sanitary state, the humidity content, etc.
In particular, this curve trend, in the visible, near and mid infrared bands, is regulated respectively by the foliar pigments content and type, the foliar structure and the content in the water.
In the study of vegetation, the Planet constellation sensors have been specifically designed to pull out full information
FORESTS
The Planet system with its five spectral bands can be a useful support tool for public organizations and research institutes in the vegetation types classification process, in the inventories management, in the change, phenological state and forests health check, analyzing in detail what happened, is happening, or is about to occur in certain wooded areas, even for damage caused by fire.
Some possible applications in the forestry scope:
- Definition of vegetation types by classification process and photo interpretation
- Determination of areas affected by fires
- Definition of fire risk
- Determination of deforested areas
- Biomass estimation by correlations with vegetation index

Planet multispectral data classifications are comparable to classifications carried out with Spot 5 images with areas higher definition.
LAND USE (corine land cover)
The Land Use Chart is a basic thematic map representing the current state of territory usage and it is part of the Corine Land Cover Project of the European Union.
The Land Use Chart, together with a shared language and in accordance to EU directives, is based on 5 main classes (artificial surfaces, used agricultural surfaces, wooded surfaces and semi-natural environments, humid environment, water environment) and evolves into subsequent levels of detail on the representation scale.
It constitutes an indispensable aid for research in the field of natural and territorial sciences, scheduling, planning and management of the different territorial levels.
The technical specifications for land use classification Corine Land Cover 1990, 2000, 2006 foresee the use of satellite images with a minimum cartographic unit equal to 25 hectares. In particular, the specification referring to the CLC 2006 contemplates and recommends the use of satellite images with a medium-high resolution to identify changements and updates of these database.
In this context, Planet images meet the requirements in a large scale.
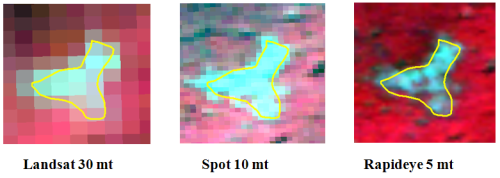
Planet multispectral data classifications are comparable to the classifications carried out with Spot 5 images with Example 1

Satellite multispectral data classifications are comparable to the classifications carried out with Spot 5 images with Example 2
SAFETY, ENVIRONMENTAL MONITORING AND TERRITORY PLANNING
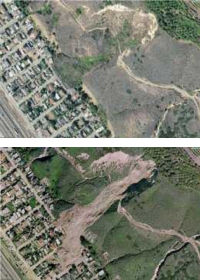
Satellite new constellation is able to provide powerful tools to help public administrations and companies interested in managing emergencies (and consequently the protection of national security), as well as the landscape modifications and urban interventions control.
The five satellites also provide an important contribution to the identification and control of any disaster risk areas or to support environmental impact assessments (such as a future subdivision); this is finalized both to prevention and consequently to a better response in front of emergencies due to storms, fires, floods, earthquakes and landslides, both to the optimization of land use planning activities.
Thanks to the development of customized GIS solutions (integrated by geospatial data in particular remotly sensed by satellite), those who deal with natural resources, such as biologists, agronomists, foresters, agricultural operators, geologists, engineers can for example:
- Manage, analyze and shape information
- Create statistics, estimates, simulations and make forecasts
- Store, share, publish data
- Optimize natural resources management
- Support the conservation of the environment and biodiversity
Furthermore, Iptsat is able to develop technological infrastructures for biodiversity data management through the implementation of:
- Biocase and Geocase software tool
- GBIF software tool
- Standardization and structuring of databases according to ABCD v. 2.6

GIS AND THE FLORA
Today, GIS offers a powerful analytical tool to understand the key aspects of ecology and vegetal biology such as the geographical distribution and the phenology of plants, which, in turn, affects important factors such as earth’s climate and agricultural productions.
GIS helps to identify the impact of human behavior on natural resources and leads to a more effective use of the one. Natural vegetal resources data, collected on a large scale even through remote sensing and processed through spatial and spectral analysis, allow a 360 ° vision of the vegetal resources physiological state in fast times.
GIS AND THE FAUNA
Nowadays, the Global Positioning System (GPS) satellite navigation receivers are more and more employed in ecological and behavioral studies to track animal movements in relation to the environments in which they live and feed themselves.
Combining the GPS movement of animals with their habitats maps and the vegetation through GIS tools, it is possible for example, to relate the animals movement and the foraging position with the landscape and habitat characteristics, together with the types of vegetation.
This powerful approach is opening up new opportunities to the study of animal behavior spatial aspects, especially food seeking and social behaviors, with much more precision and objectivity than the past.
WATERS
Water, which covers about 70% of the globe’s surface, is increasingly a critical resource for the survival of mankind. In recent decades, there have been many initiatives to safeguard and check this resource, by controlling some representative parameters of water quality such as the color of the water, the turbidity, the Chlorophyll, the Temperature, the Algae Distribution and the extremely dangerous hydrocarbon and / or Chemicals pollution.
THE WATERS COLOR
The suspended material, the colored pigments, the dissolved carbon presence and the humus fraction affect the chromatic values of the visible tristimulus (blue, green and red). The analysis of the three color components (saturation, tint and intensity) is therefore enough to define the trophic state of a water mass, at least at the qualitative level of the three classes oligotrophic, mesotrophic and eutrophic.
TURBIDITY MAPS
Turbidity is one of the parameters allowing to evaluate water quality; in fact, exactly a low turbidity level is one of the most appreciated characteristics for quality tourism. For water quality analysis, it is possible to obtain a turbidity measurement in terms of Transparency Index, directly from satellite and aerial images.Furthermore, it is possible to evaluate the water Beam Attenuation Coefficient (BAC) with remote sensing, parameter correlated with suspended solids for well-defined depth bands.
CHLOROPHYL CONTENT DETERMINATION
The content of chlorophyll in water is an index of development and growth of algal vegetation. The presence of chlorophyll in water influences considerably the reflected radiance of the surface and for this reason it is determinable by the satellite images analysis.
TEMPERATURE MAPS
The use of infrared spectral range band (10.4-12.5 mm) enables to realize superficial temperature maps and follow its evolution over the time. It is also possible to locate precise discharges in the water body byusing an appropriate geometrical scale for the examined problem itself
ALGAL DISTRIBUTION 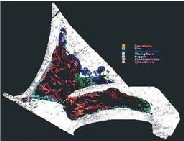 It is possible to map the algal vegetation in the shallow waters and obtain the monitoring of important biological parameters through multitemporal controls (among others: Posidonia oceanica) by using aerial multispectral sensors. It is also possible to determine the presence and development of mucilage on the surface of marine waters through multitemporal analysis.
HYDROCARBONS AND CHEMICAL PRODUCTS IN THE SEA 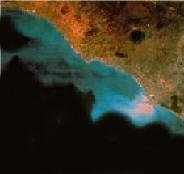 Oil stains on the sea surface can appear after ships accidents or from oil platforms or for illegal oily waste spills. To remove and check these patches is of primary importance to limit their drastic effects on the marine environment. By the processing of radar images it is possible to define the exact position, density and extension of oil spills into the sea.
PREVENTION AND CONTROL OF FOREST FIRES It is possible to fix software dedicated to the fire development models through the territory analysis and the state of the vegetation cover; these softwares allow the access to tools capable of indicating the site where a fire could probably start, in what direction it could spread and with what intensity. An appropriate territorial information system allows a rapid evaluation of the danger level and the consequent planning of preventive, containment and rescue operations.
Fire Prevention.
FIRE REGISTER
Iptsat, through its great experience, is able to solve the problem of the fire register by creating specific databases and dedicated GIS, able to keep track of all the events that happened in the area. All of this in order to facilitate monitoring, controlling and prevention activities, as established by law no. 353 of 11/21/2000 “Law on forested fires”.
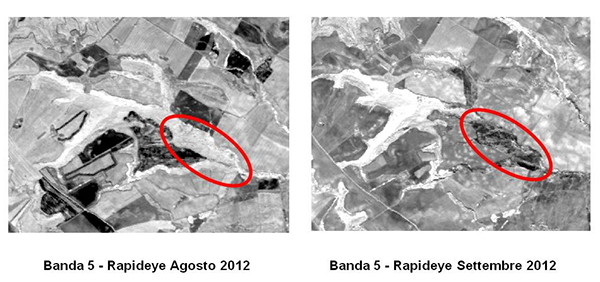
Infrared band comparison next to Planet August 2012-September 2012
Tags
Links of interest
Rome office
Via Sallustiana, 23
00187 – Roma
+39 0642041717
+39 0642041703
info@iptsat.com
