AGRICULTURE
Planet is recognized as one of the few satellite constellations capable of responding quickly and accurately to the requests of people working in the agricultural scope; in fact, the Planet data allow customers to take advantage of their crops images by monitoring to the best their agricultural resources, in every season, all over the year Some possible applications in agriculture:
- Mapping of fields and classification of crops. Evaluation and check of the phenological steps for the agrometeorological models tuning
- Plant health analysis and monitoring of parasitic infestations
- Estimation of damage caused by natural disasters (hail, snow, floods&) or by any other event (fires, earthquakes, landslides …)
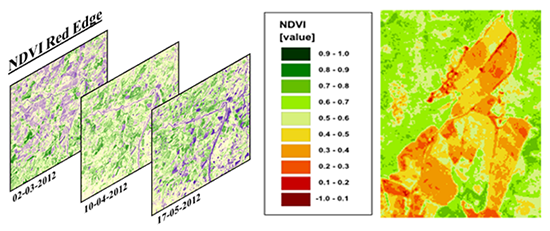
- Creation of NDVI, NDVI Red Edge, fPAR, LAI, Chlorophyll, OSAVI, TCARI, MCARI maps…
- Irrigation water management
- Agricultural productivity management
VEGETATION
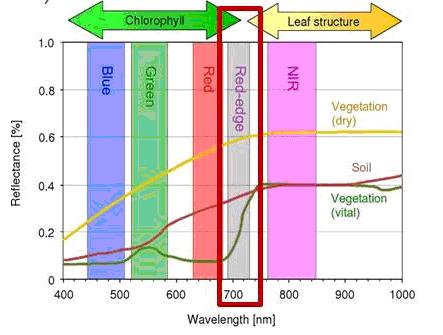
Remote Sensing – Planet Bands Vegetation shows specific spectral behaviors with different wavelengths, producing a characteristic sign.
The reflectance curve can vary its trend depending on many factors such as the vegetation type and its density, the phenological stage, the phyto-sanitary state, the humidity content, etc.
In particular, this curve trend, in the visible, near and mid infrared bands, is regulated respectively by the foliar pigments content and type, the foliar structure and the content in the water.
In the study of vegetation, the Planet constellation sensors have been specifically designed to pull out full information
FORESTS
The Planet system with its five spectral bands can be a useful support tool for public organizations and research institutes in the vegetation types classification process, in the inventories management, in the change, phenological state and forests health check, analyzing in detail what happened, is happening, or is about to occur in certain wooded areas, even for damage caused by fire.
Some possible applications in the forestry scope:
- Definition of vegetation types by classification process and photo interpretation
- Determination of areas affected by fires
- Definition of fire risk
- Determination of deforested areas
- Biomass estimation by correlations with vegetation index

LAND USE (corine land cover)
The Land Use Chart is a basic thematic map representing the current state of territory usage and it is part of the Corine Land Cover Project of the European Union.
The Land Use Chart, together with a shared language and in accordance to EU directives, is based on 5 main classes (artificial surfaces, used agricultural surfaces, wooded surfaces and semi-natural environments, humid environment, water environment) and evolves into subsequent levels of detail on the representation scale.
It constitutes an indispensable aid for research in the field of natural and territorial sciences, scheduling, planning and management of the different territorial levels.
The technical specifications for land use classification Corine Land Cover 1990, 2000, 2006 foresee the use of satellite images with a minimum cartographic unit equal to 25 hectares. In particular, the specification referring to the CLC 2006 contemplates and recommends the use of satellite images with a medium-high resolution to identify changements and updates of these database.
In this context, Planet images meet the requirements in a large scale.
SAFETY, ENVIRONMENTAL MONITORING AND TERRITORY PLANNING
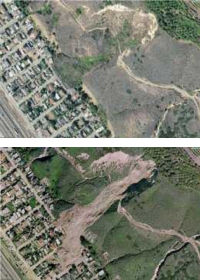
Satellite new constellation is able to provide powerful tools to help public administrations and companies interested in managing emergencies (and consequently the protection of national security), as well as the landscape modifications and urban interventions control.
The five satellites also provide an important contribution to the identification and control of any disaster risk areas or to support environmental impact assessments (such as a future subdivision); this is finalized both to prevention and consequently to a better response in front of emergencies due to storms, fires, floods, earthquakes and landslides, both to the optimization of land use planning activities.
Thanks to the development of customized GIS solutions (integrated by geospatial data in particular remotly sensed by satellite), those who deal with natural resources, such as biologists, agronomists, foresters, agricultural operators, geologists, engineers can for example:
- Manage, analyze and shape information
- Create statistics, estimates, simulations and make forecasts
- Store, share, publish data
- Optimize natural resources management
- Support the conservation of the environment and biodiversity
Furthermore, Iptsat is able to develop technological infrastructures for biodiversity data management through the implementation of:
- Biocase and Geocase software tool
- GBIF software tool
- Standardization and structuring of databases according to ABCD v. 2.6
GIS AND THE FLORA
Today, GIS offers a powerful analytical tool to understand the key aspects of ecology and vegetal biology such as the geographical distribution and the phenology of plants, which, in turn, affects important factors such as earth’s climate and agricultural productions.
GIS helps to identify the impact of human behavior on natural resources and leads to a more effective use of the one. Natural vegetal resources data, collected on a large scale even through remote sensing and processed through spatial and spectral analysis, allow a 360 ° vision of the vegetal resources physiological state in fast times.
GIS AND THE FAUNA
Nowadays, the Global Positioning System (GPS) satellite navigation receivers are more and more employed in ecological and behavioral studies to track animal movements in relation to the environments in which they live and feed themselves.
Combining the GPS movement of animals with their habitats maps and the vegetation through GIS tools, it is possible for example, to relate the animals movement and the foraging position with the landscape and habitat characteristics, together with the types of vegetation.
This powerful approach is opening up new opportunities to the study of animal behavior spatial aspects, especially food seeking and social behaviors, with much more precision and objectivity than the past.
WATERS
Water, which covers about 70% of the globe’s surface, is increasingly a critical resource for the survival of mankind. In recent decades, there have been many initiatives to safeguard and check this resource, by controlling some representative parameters of water quality such as the color of the water, the turbidity, the Chlorophyll, the Temperature, the Algae Distribution and the extremely dangerous hydrocarbon and / or Chemicals pollution.
THE WATERS COLOR
The suspended material, the colored pigments, the dissolved carbon presence and the humus fraction affect the chromatic values of the visible tristimulus (blue, green and red). The analysis of the three color components (saturation, tint and intensity) is therefore enough to define the trophic state of a water mass, at least at the qualitative level of the three classes oligotrophic, mesotrophic and eutrophic.
TURBIDITY MAPS
Turbidity is one of the parameters allowing to evaluate water quality; in fact, exactly a low turbidity level is one of the most appreciated characteristics for quality tourism. For water quality analysis, it is possible to obtain a turbidity measurement in terms of Transparency Index, directly from satellite and aerial images.Furthermore, it is possible to evaluate the water Beam Attenuation Coefficient (BAC) with remote sensing, parameter correlated with suspended solids for well-defined depth bands.
CHLOROPHYL CONTENT DETERMINATION
The content of chlorophyll in water is an index of development and growth of algal vegetation. The presence of chlorophyll in water influences considerably the reflected radiance of the surface and for this reason it is determinable by the satellite images analysis.
TEMPERATURE MAPS
The use of infrared spectral range band (10.4-12.5 mm) enables to realize superficial temperature maps and follow its evolution over the time. It is also possible to locate precise discharges in the water body byusing an appropriate geometrical scale for the examined problem itself
ALGAL DISTRIBUTION 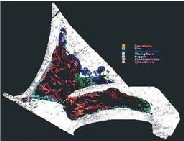 It is possible to map the algal vegetation in the shallow waters and obtain the monitoring of important biological parameters through multitemporal controls (among others: Posidonia oceanica) by using aerial multispectral sensors. It is also possible to determine the presence and development of mucilage on the surface of marine waters through multitemporal analysis.
HYDROCARBONS AND CHEMICAL PRODUCTS IN THE SEA 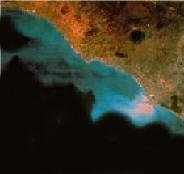 Oil stains on the sea surface can appear after ships accidents or from oil platforms or for illegal oily waste spills. To remove and check these patches is of primary importance to limit their drastic effects on the marine environment. By the processing of radar images it is possible to define the exact position, density and extension of oil spills into the sea.
PREVENTION AND CONTROL OF FOREST FIRES It is possible to fix software dedicated to the fire development models through the territory analysis and the state of the vegetation cover; these softwares allow the access to tools capable of indicating the site where a fire could probably start, in what direction it could spread and with what intensity. An appropriate territorial information system allows a rapid evaluation of the danger level and the consequent planning of preventive, containment and rescue operations.
Fire Prevention.
FIRE REGISTER
Iptsat, through its great experience, is able to solve the problem of the fire register by creating specific databases and dedicated GIS, able to keep track of all the events that happened in the area. All of this in order to facilitate monitoring, controlling and prevention activities, as established by law no. 353 of 11/21/2000 “Law on forested fires”.
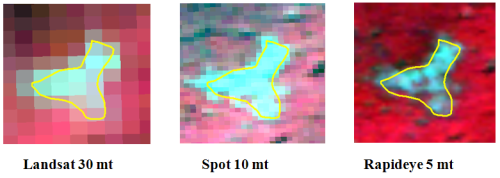
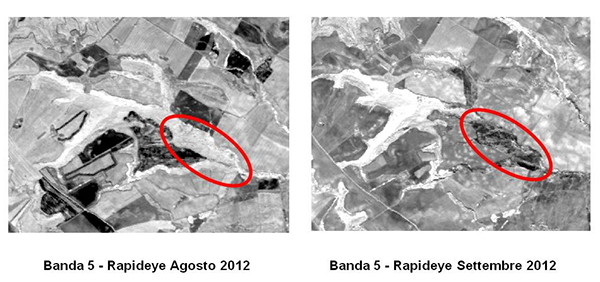
Infrared band comparison next to Planet August 2012-September 2012
